一键采集cpu生成火焰图

cpu 性能分析

CPU 性能分析工具很多,我常用的工具是 perf 工具。

perf

perf 是 Linux 上的一款性能分析工具,可以对 on-cpu、off-cpu、memory 等进行采集分析。on-cpu 是指程序运行在 cpu 上的时间,off-cpu 是指程序阻塞在锁、IO 事件、cpu 调度等的时间, memory 采集是针对内存堆栈的采集(我没有用过)。

perf 的原理是定时在 cpu 上产生一个中断,然后看一下此时正在执行的是哪一个 pid,那个函数,然后进行统计汇总,最后形成一幅 cpu 的采样图。消耗 cpu 越多的函数理论上被采集到的次数以及概率就会越多,那么根据采样得到的比例就能推算出哪里是性能热点,哪里能进行性能优化。

火焰图

perf 采集到的数据无法直观的感受到程序性能消耗情况,通常我们会结合火焰图来分析。火焰图顾名思义,就是一幅像火焰的图,它对 perf 采集到的数据进行了分析,直观的把进程和函数对 cpu 的消耗情况进行了统计和展示。如下图:

如何分析火焰图

火焰图的横轴和纵轴没有具体的单位,纵轴表示调用栈,横轴代表 cpu 百分比,也就是说整个横轴看成 100% cpu,由不同的进程组成,每个进程占用的 cpu 百分比之和就是 100%。

占用 cpu 百分比较多的函数就是我们重点关注的对象,另外如果一个火焰的顶部呈水平秃顶的状态,那么这个函数通常要重点关注,可能有性能瓶颈。

一键采集脚本

特性

上面简单对 perf 和火焰图做了一点介绍,这不是本文的重点。通过使用 perf 采集 cpu 数据,并利用一些工具生成火焰图的过程稍微复杂,所以下面分享一个我自己写的脚本:

https://github.com/smaugx/dailytools/blob/master/flamesvg.sh

该脚本实现以下功能:

  • 自动安装采集过程的依赖包和工具
  • 一键采集 cpu 信息
  • 一键生成火焰图
  • 一键生成文本形式的采样图
  • 支持自定义采集时间长短
  • 支持 ubuntu 和 centos

使用

获取脚本

可以直接打开下面的 url 拷贝脚本内容到新的文件 flamesvg.sh:

https://github.com/smaugx/dailytools/blob/master/flamesvg.sh

或者执行以下命令:

1
wget https://raw.githubusercontent.com/smaugx/dailytools/master/flamesvg.sh

采集

1
2
3
4
5
6
7
8
9
10
11
12
13
14
15
16
17
18
19
20
21
22
23
24
25
26
27
28
29
30
31
32
33
34
35
36
37
38
$ sh flamesvg.sh  record
sudo yum install perf -y
Loaded plugins: fastestmirror, langpacks
Loading mirror speeds from cached hostfile
* base: mirror.atlanticmetro.net
* epel: epel.mirror.constant.com
* extras: mirror.math.princeton.edu
* updates: centos5.zswap.net
Package perf-3.10.0-1127.19.1.el7.x86_64 already installed and latest version
Nothing to do
sudo yum install git -y
Loaded plugins: fastestmirror, langpacks
Loading mirror speeds from cached hostfile
* base: mirror.atlanticmetro.net
* epel: epel.mirror.constant.com
* extras: mirror.math.princeton.edu
* updates: centos5.zswap.net
Package git-1.8.3.1-23.el7_8.x86_64 already installed and latest version
Nothing to do
git clone https://github.com/brendangregg/FlameGraph
Cloning into 'FlameGraph'...
remote: Enumerating objects: 1, done.
remote: Counting objects: 100% (1/1), done.
remote: Total 1067 (delta 0), reused 0 (delta 0), pack-reused 1066
Receiving objects: 100% (1067/1067), 1.87 MiB | 0 bytes/s, done.
Resolving deltas: 100% (612/612), done.
sudo perf record --call-graph dwarf -a sleep 10
[ perf record: Woken up 19 times to write data ]
[ perf record: Captured and wrote 6.307 MB perf.data (1544 samples) ]

第一次进行采集会安装相关的依赖,后续就不用了,如下:

1
2
3
4
$ sh flamesvg.sh record
sudo perf record --call-graph dwarf -a sleep 10
[ perf record: Woken up 17 times to write data ]
[ perf record: Captured and wrote 5.403 MB perf.data (1364 samples) ]

执行完毕会在当前目录生成一个 perf.data 文件,该文件就是采集到的 cpu 数据。

生成火焰图

完成上述的 record 命令之后:

1
2
3
4
$ sh flamesvg.sh  svg
flame svg file generated: perf.svg
ls perf.svg
perf.svg

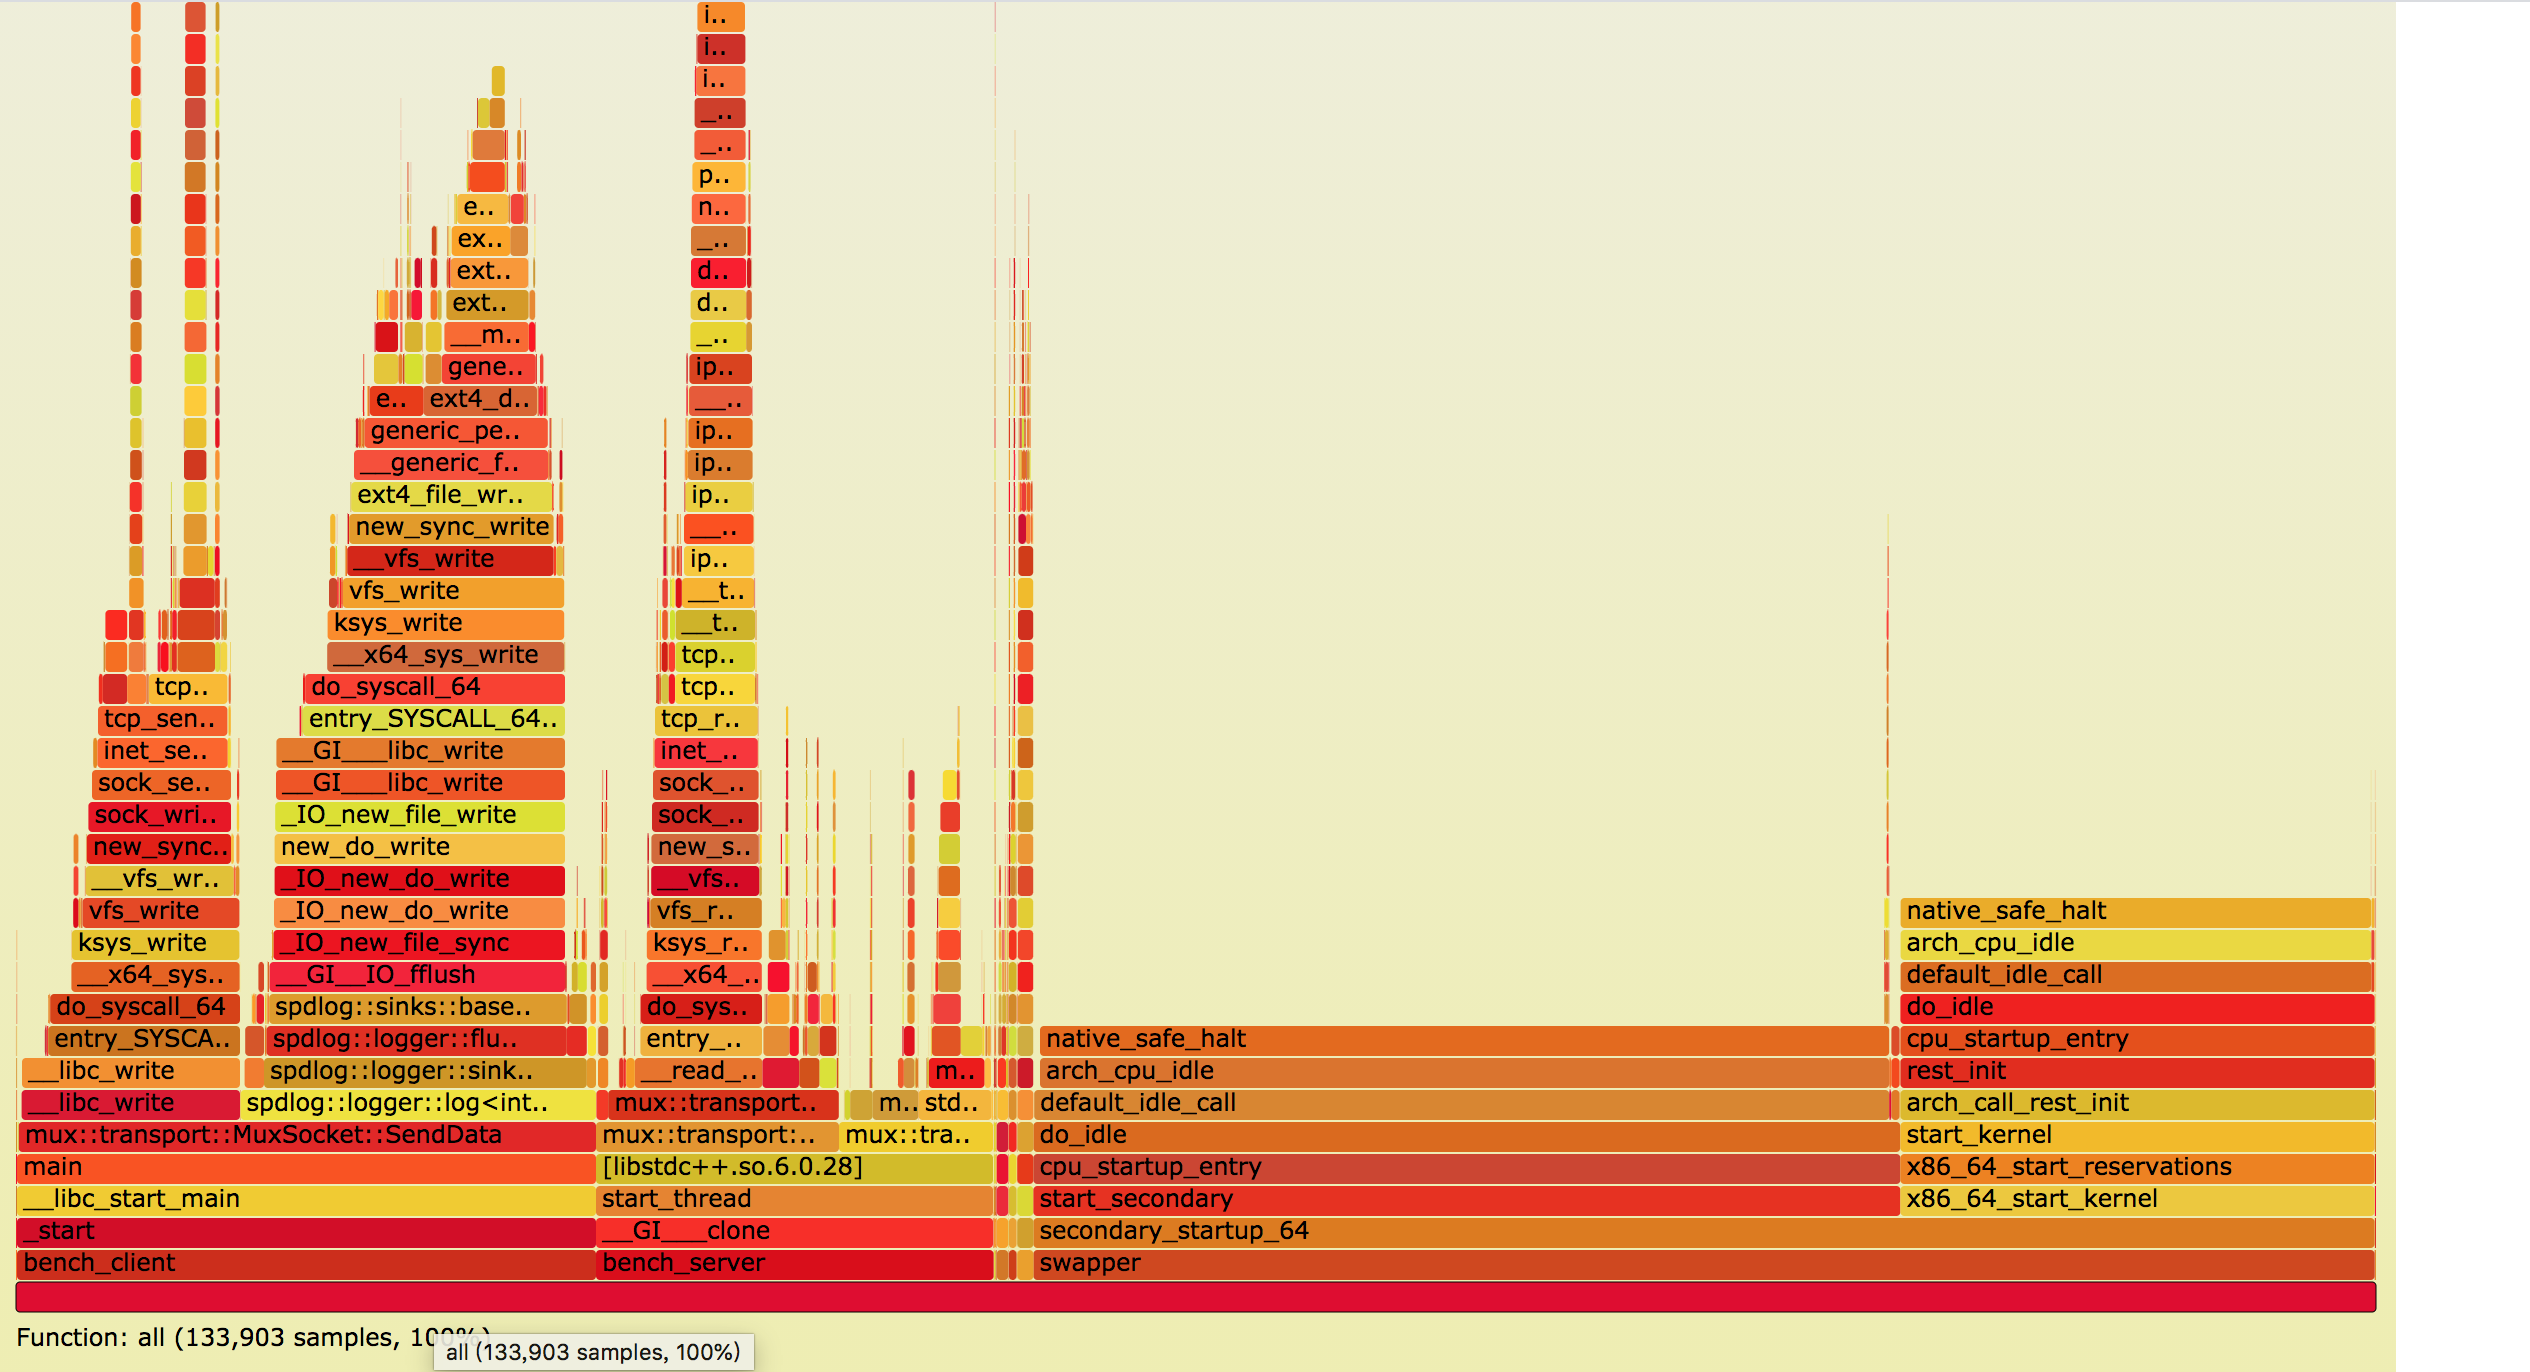
执行完毕会在当前目录生成一个 perf.svg 文件,这就是最终的火焰图,可以直接用浏览器打开。

生成文本形式

完成上述的 record 命令之后:

1
2
3
4
$ sh flamesvg.sh  txt
perf_symbol(function).data generated
ls perf_symbol.data
perf_symbol.data

执行完毕会在当前目录生成一个 perf_symbol.data,该文件是一种文本形式的展示,算是对火焰图的一种替补。内容类似下面:

1
2
3
4
5
6
7
8
9
10
11
12
13
14
15
16
17
18
19
20
21
22
23
24
25
26
27
28
29
30
31
32
33
34
35
36
37
38
39
40
41
42
43
44
45
46
$ cat perf_symbol.data 
# To display the perf.data header info, please use --header/--header-only options.
#
#
# Total Lost Samples: 0
#
# Samples: 1K of event 'cycles'
# Event count (approx.): 189130981
#
# Overhead Command Symbol
# ........ ............. ..............................................................................
#
2.58% swapper [k] apic_timer_interrupt
|
---apic_timer_interrupt
|
--2.45%--default_idle
arch_cpu_idle
cpu_startup_entry
|
|--1.60%--start_secondary
| start_cpu
|
--0.85%--rest_init
start_kernel
x86_64_start_reservations
x86_64_start_kernel
start_cpu

1.65% swapper [k] native_write_msr_safe
|
---native_write_msr_safe
|
--1.14%--lapic_next_deadline
clockevents_program_event
tick_program_event
|
--0.69%--hrtimer_interrupt
local_apic_timer_interrupt
smp_apic_timer_interrupt
apic_timer_interrupt
default_idle
arch_cpu_idle
cpu_startup_entry

1.53% swapper [k] __schedule

文本形式也能比较直观的看到 cpu 的分布情况。

是不是很方便?

The END

关于 perf 工具,它能做的不止这些。

Blog:

2019-11-05 于杭州
By 史矛革

buy me a cola!

欢迎关注我的其它发布渠道