valgrind massif 分析内存问题

Valgrind Massif

valgrind 是什么,这里直接引用其他人的博客:

Valgrind是一套Linux下,开放源代码(GPL
V2)的仿真调试工具的集合。Valgrind由内核(core)以及基于内核的其他调试工具组成。

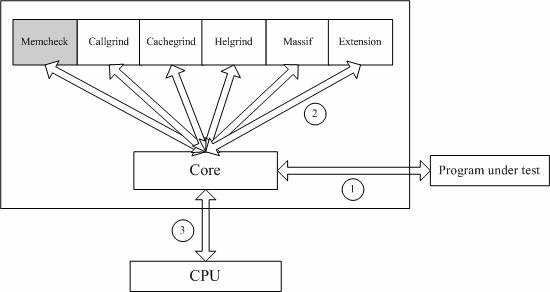
内核类似于一个框架(framework),它模拟了一个CPU环境,并提供服务给其他工具;而其他工具则类似于插件 (plug-in),利用内核提供的服务完成各种特定的内存调试任务。

Valgrind的体系结构如下图所示:

Massif 命令行选项

关于 massif 命令行选项,可以直接查看 valgrind 的 help 信息:

1
2
3
4
5
6
7
8
9
10
11
12
13
14
15
16
17
18
19
20
21
22
23
24
25
26
27
28
29
30
31
32
33
34
35
36
37
38
39
40
41
42
43
44
45
46
47
48
49
50
51
52
53
54
55
56
57
58
59
60
61
62
63
64
65
66
67
68

MASSIF OPTIONS
--heap=<yes|no> [default: yes]
Specifies whether heap profiling should be done.

--heap-admin=<size> [default: 8]
If heap profiling is enabled, gives the number of administrative bytes per block to use. This should be an estimate of the average, since it may vary. For example, the
allocator used by glibc on Linux requires somewhere between 4 to 15 bytes per block, depending on various factors. That allocator also requires admin space for freed blocks,
but Massif cannot account for this.

--stacks=<yes|no> [default: no]
Specifies whether stack profiling should be done. This option slows Massif down greatly, and so is off by default. Note that Massif assumes that the main stack has size zero
at start-up. This is not true, but doing otherwise accurately is difficult. Furthermore, starting at zero better indicates the size of the part of the main stack that a user
program actually has control over.

--pages-as-heap=<yes|no> [default: no]
Tells Massif to profile memory at the page level rather than at the malloc'd block level. See above for details.

--depth=<number> [default: 30]
Maximum depth of the allocation trees recorded for detailed snapshots. Increasing it will make Massif run somewhat more slowly, use more memory, and produce bigger output
files.

--alloc-fn=<name>
Functions specified with this option will be treated as though they were a heap allocation function such as malloc. This is useful for functions that are wrappers to malloc or
new, which can fill up the allocation trees with uninteresting information. This option can be specified multiple times on the command line, to name multiple functions.

Note that the named function will only be treated this way if it is the top entry in a stack trace, or just below another function treated this way. For example, if you have a
function malloc1 that wraps malloc, and malloc2 that wraps malloc1, just specifying --alloc-fn=malloc2 will have no effect. You need to specify --alloc-fn=malloc1 as well.
This is a little inconvenient, but the reason is that checking for allocation functions is slow, and it saves a lot of time if Massif can stop looking through the stack trace
entries as soon as it finds one that doesn't match rather than having to continue through all the entries.

Note that C++ names are demangled. Note also that overloaded C++ names must be written in full. Single quotes may be necessary to prevent the shell from breaking them up. For
example:

--alloc-fn='operator new(unsigned, std::nothrow_t const&)'

--ignore-fn=<name>
Any direct heap allocation (i.e. a call to malloc, new, etc, or a call to a function named by an --alloc-fn option) that occurs in a function specified by this option will be
ignored. This is mostly useful for testing purposes. This option can be specified multiple times on the command line, to name multiple functions.

Any realloc of an ignored block will also be ignored, even if the realloc call does not occur in an ignored function. This avoids the possibility of negative heap sizes if
ignored blocks are shrunk with realloc.

The rules for writing C++ function names are the same as for --alloc-fn above.

--threshold=<m.n> [default: 1.0]
The significance threshold for heap allocations, as a percentage of total memory size. Allocation tree entries that account for less than this will be aggregated. Note that
this should be specified in tandem with ms_print's option of the same name.

--peak-inaccuracy=<m.n> [default: 1.0]
Massif does not necessarily record the actual global memory allocation peak; by default it records a peak only when the global memory allocation size exceeds the previous peak
by at least 1.0%. This is because there can be many local allocation peaks along the way, and doing a detailed snapshot for every one would be expensive and wasteful, as all
but one of them will be later discarded. This inaccuracy can be changed (even to 0.0%) via this option, but Massif will run drastically slower as the number approaches zero.

--time-unit=<i|ms|B> [default: i]
The time unit used for the profiling. There are three possibilities: instructions executed (i), which is good for most cases; real (wallclock) time (ms, i.e. milliseconds),
which is sometimes useful; and bytes allocated/deallocated on the heap and/or stack (B), which is useful for very short-run programs, and for testing purposes, because it is
the most reproducible across different machines.

--detailed-freq=<n> [default: 10]
Frequency of detailed snapshots. With --detailed-freq=1, every snapshot is detailed.

--max-snapshots=<n> [default: 100]
The maximum number of snapshots recorded. If set to N, for all programs except very short-running ones, the final number of snapshots will be between N/2 and N.

--massif-out-file=<file> [default: massif.out.%p]
Write the profile data to file rather than to the default output file, massif.out.<pid>. The %p and %q format specifiers can be used to embed the process ID and/or the
contents of an environment variable in the name, as is the case for the core option --log-file.

对其中几个常用的选项做一个说明:

  • –stacks: 栈内存的采样开关,默认关闭。打开后,会针对栈上的内存也进行采样,会使 massif 性能变慢;
  • –time-unit:指定用来分析的时间单位。这个选项三个有效值:执行的指令(i),即默认值,用于大多数情况;即时(ms,单位毫秒),可用于某些特定事务;以及在堆(/或者)栈中分配/取消分配的字节(B),用于很少运行的程序,且用于测试目的,因为它最容易在不同机器中重现。这个选项在使用 ms_print 输出结果画图是游泳
  • –detailed-freq: 针对详细内存快照的频率,默认是 10, 即每 10 个快照会有采集一个详细的内存快照
  • –massif-out-file: 采样结束后,生成的采样文件(后续可以使用 ms_print 或者 massif-visualizer 进行分析)

开始采集

经过上面的了解,接下来可以开始内存数据采集了,假设我们需要采集的二进制程序名为 xprogram:

1
valgrind -v --tool=massif --time-unit=B --detailed-freq=1 --massif-out-file=./massif.out  ./xprogram someargs

运行一段时间后,采集到足够多的内存数据之后,我们需要停止程序,让它生成采集的数据文件,使用 kill 命令让 valgrind 程序退出。

attention: 这里禁止使用 kill -9 模式去杀进程,不然不会产生采样文件

ms_print 分析采样文件

ms_print 是用来分析 massif 采样得到的内存数据文件的,使用命令为:

1
ms_print ./massif.out

或者把输出保存到文件:

1
ms_print ./massif.out > massif.result

打开 massif.result 看看长啥样:

1
2
3
4
5
6
7
8
9
10
11
12
13
14
15
16
17
18
19
20
21
22
23
24
25
26
27
28
29
30
31
32
33
--------------------------------------------------------------------------------
Command: ./xprogram someargs
Massif arguments: --time-unit=B --massif-out-file=./massif.out
ms_print arguments: massif.out
--------------------------------------------------------------------------------


GB
1.279^ #
| #
| @ @#
| @::@#
| @:@: @#
| @:: @:@: @#
| : ::::@: ::@:@: @#
| @ @@@@ :::::: :@: : @:@: @#
| : @:@ @ @: :::: :@: : @:@: @#
| @ :::::@:@ @ @: :::: :@: : @:@: @#
| @@:::@@::: :: @:@ @ @: :::: :@: : @:@: @#
| :::@ : :@@: : :: @:@ @ @: :::: :@: : @:@: @#
| :: @@::::: @ : :@@: : :: @:@ @ @: :::: :@: : @:@: @#
| :::: :@ :: :: @ : :@@: : :: @:@ @ @: :::: :@: : @:@: @#
| @ :::::::: :@ :: :: @ : :@@: : :: @:@ @ @: :::: :@: : @:@: @#
| ::@::: : :::: :@ :: :: @ : :@@: : :: @:@ @ @: :::: :@: : @:@: @#
| ::::@: : : :::: :@ :: :: @ : :@@: : :: @:@ @ @: :::: :@: : @:@: @#
| :: ::@: : : :::: :@ :: :: @ : :@@: : :: @:@ @ @: :::: :@: : @:@: @#
| @@:: ::@: : : :::: :@ :: :: @ : :@@: : :: @:@ @ @: :::: :@: : @:@: @#
| ::@ :: ::@: : : :::: :@ :: :: @ : :@@: : :: @:@ @ @: :::: :@: : @:@: @#
0 +----------------------------------------------------------------------->GB
0 813.9

Number of snapshots: 68
Detailed snapshots: [2, 7, 16, 21, 24, 25, 30, 32, 33, 34, 41, 44, 46, 48, 51, 52, 58, 59, 61, 64, 65, 66, 67 (peak)]

这张图大概意思就表示堆内存的分配量随着采样时间的变化。从上图可以看到堆内存一直在增长,可能存在一些内存泄露等问题。

往下看还能看到内存的分配栈:

1
2
3
4
5
6
7
8
9
10
11
12
13
14
15
16
17
18
19
20
21
22
  0              0                0                0             0            0
1 20,021,463,688 133,278,776 124,687,612 8,591,164 0
2 45,201,848,936 204,228,232 191,089,596 13,138,636 0
93.57% (191,089,596B) (heap allocation functions) malloc/new/new[], --alloc-fns, etc.
->41.07% (83,886,080B) 0xF088E6: rocksdb::Arena::AllocateNewBlock(unsigned long) (in /chain/xtopchain)
| ->41.07% (83,886,080B) 0xF08500: rocksdb::Arena::AllocateFallback(unsigned long, bool) (in /chain/xtopchain)
| ->41.07% (83,886,080B) 0xF0886C: rocksdb::Arena::AllocateAligned(unsigned long, unsigned long, rocksdb::Logger*) (in /chain/xtopchain)
| ->41.07% (83,886,080B) 0xDE62BC: rocksdb::ConcurrentArena::AllocateAligned(unsigned long, unsigned long, rocksdb::Logger*)::{lambda()
| | ->41.07% (83,886,080B) 0xDE7D9A: char* rocksdb::ConcurrentArena::AllocateImpl<rocksdb::ConcurrentArena::AllocateAligned(unsigned long, unsigned long, rocksdb::Logger*)::{lambda()
| | ->41.07% (83,886,080B) 0xDE6371: rocksdb::ConcurrentArena::AllocateAligned(unsigned long, unsigned long, rocksdb::Logger*) (in /chain/xtopchain)
| | ->41.07% (83,886,080B) 0xE6FAB0: rocksdb::InlineSkipList<rocksdb::MemTableRep::KeyComparator const&>::AllocateNode(unsigned long, int) (in /chain/xtopchain)
| | ->41.07% (83,886,080B) 0xE6F472: rocksdb::InlineSkipList<rocksdb::MemTableRep::KeyComparator const&>::AllocateKey(unsigned long) (in /chain/xtopchain)
| | ->41.07% (83,886,080B) 0xE6E40A: rocksdb::(anonymous namespace)::SkipListRep::Allocate(unsigned long, char**) (in /chain/xtopchain)
| | ->41.07% (83,886,080B) 0xDE32E3: rocksdb::MemTable::Add(unsigned long, rocksdb::ValueType, rocksdb::Slice const&, rocksdb::Slice const&, bool, rocksdb::MemTablePostProcessInfo*) (in /chain/xtopchain)
| | ->41.07% (83,886,080B) 0xE5C218: rocksdb::MemTableInserter::PutCFImpl(unsigned int, rocksdb::Slice const&, rocksdb::Slice const&, rocksdb::ValueType) (in /chain/xtopchain)
| | ->41.07% (83,886,080B) 0xE5C92C: rocksdb::MemTableInserter::PutCF(unsigned int, rocksdb::Slice const&, rocksdb::Slice const&) (in /chain/xtopchain)
| | ->41.07% (83,886,080B) 0xE570E4: rocksdb::WriteBatch::Iterate(rocksdb::WriteBatch::Handler*) const (in /chain/xtopchain)
| | ->41.07% (83,886,080B) 0xE598D5: rocksdb::WriteBatchInternal::InsertInto(rocksdb::WriteThread::WriteGroup&, unsigned long, rocksdb::ColumnFamilyMemTables*, rocksdb::FlushScheduler*, bool, unsigned long, rocksdb::DB*, bool, bool, bool) (in /chain/xtopchain)
| | ->41.07% (83,886,080B) 0xD45AD7: rocksdb::DBImpl::WriteImpl(rocksdb::WriteOptions const&, rocksdb::WriteBatch*, rocksdb::WriteCallback*, unsigned long*, unsigned long, bool, unsigned long*, unsigned long, rocksdb::PreReleaseCallback*) (in /chain/xtopchain)
| | ->28.75% (58,720,256B) 0x1013B9C: rocksdb::WriteCommittedTxn::CommitWithoutPrepareInternal() (in /chain/xtopchain)
| | | ->28.75% (58,720,256B) 0x1013653: rocksdb::PessimisticTransaction::Commit() (in /chain/xtopchain)
| | | ->28.75% (58,720,256B) 0xF40E17: rocksdb::PessimisticTransactionDB::Put(rocksdb::WriteOptions const&, rocksdb::ColumnFamilyHandle*, rocksdb

能看到内存分配的调用堆栈情况,据此可以看到哪里分配的内存较多。

massif-visualizer 可视化分析采样文件

ms_print 一定程度上不够直观,所以祭出另外一个分析内存采样数据的大杀器 – massif-visualizer,它能可视化的展示内存分配随着采样时间的变化情况,并能直观的看到内存分配的排行榜

注意: massif-visualizer 目前好像只支持 linux 环境,并且具有桌面环境的 Linux. (mac/windows 的版本我没有找到)。

故我们采用 ubuntu-20.04-lts 作为分析环境。

安装软件

直接在软件中心搜索 massif-visualizer,然后安装

启动软件,分析数据

双击 massif-visualizer 启动软件之后,打开并选中某个 massif.out 文件,或者用命令行的方式打开:

1
massif-visualizer ./massif.out

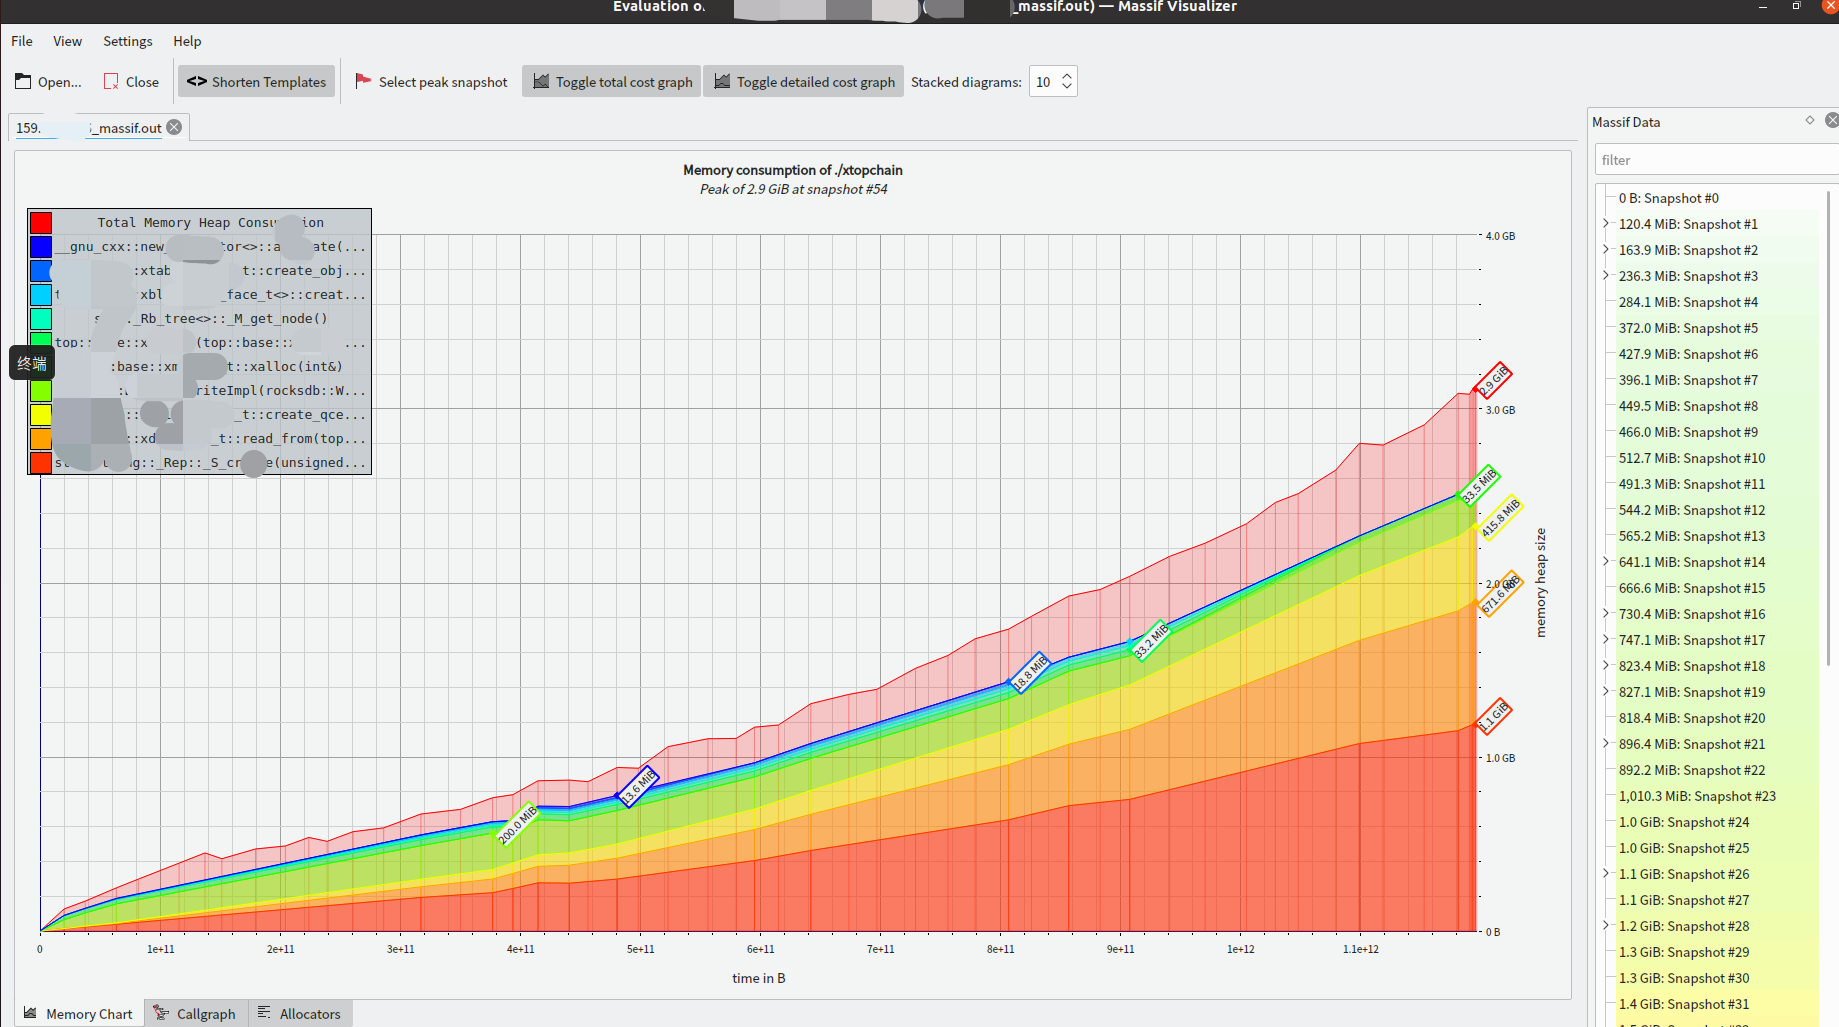
启动后,能直观的看到内存随采样时间的变化情况:

调整上面的选项 Stacked diagrams 值后:

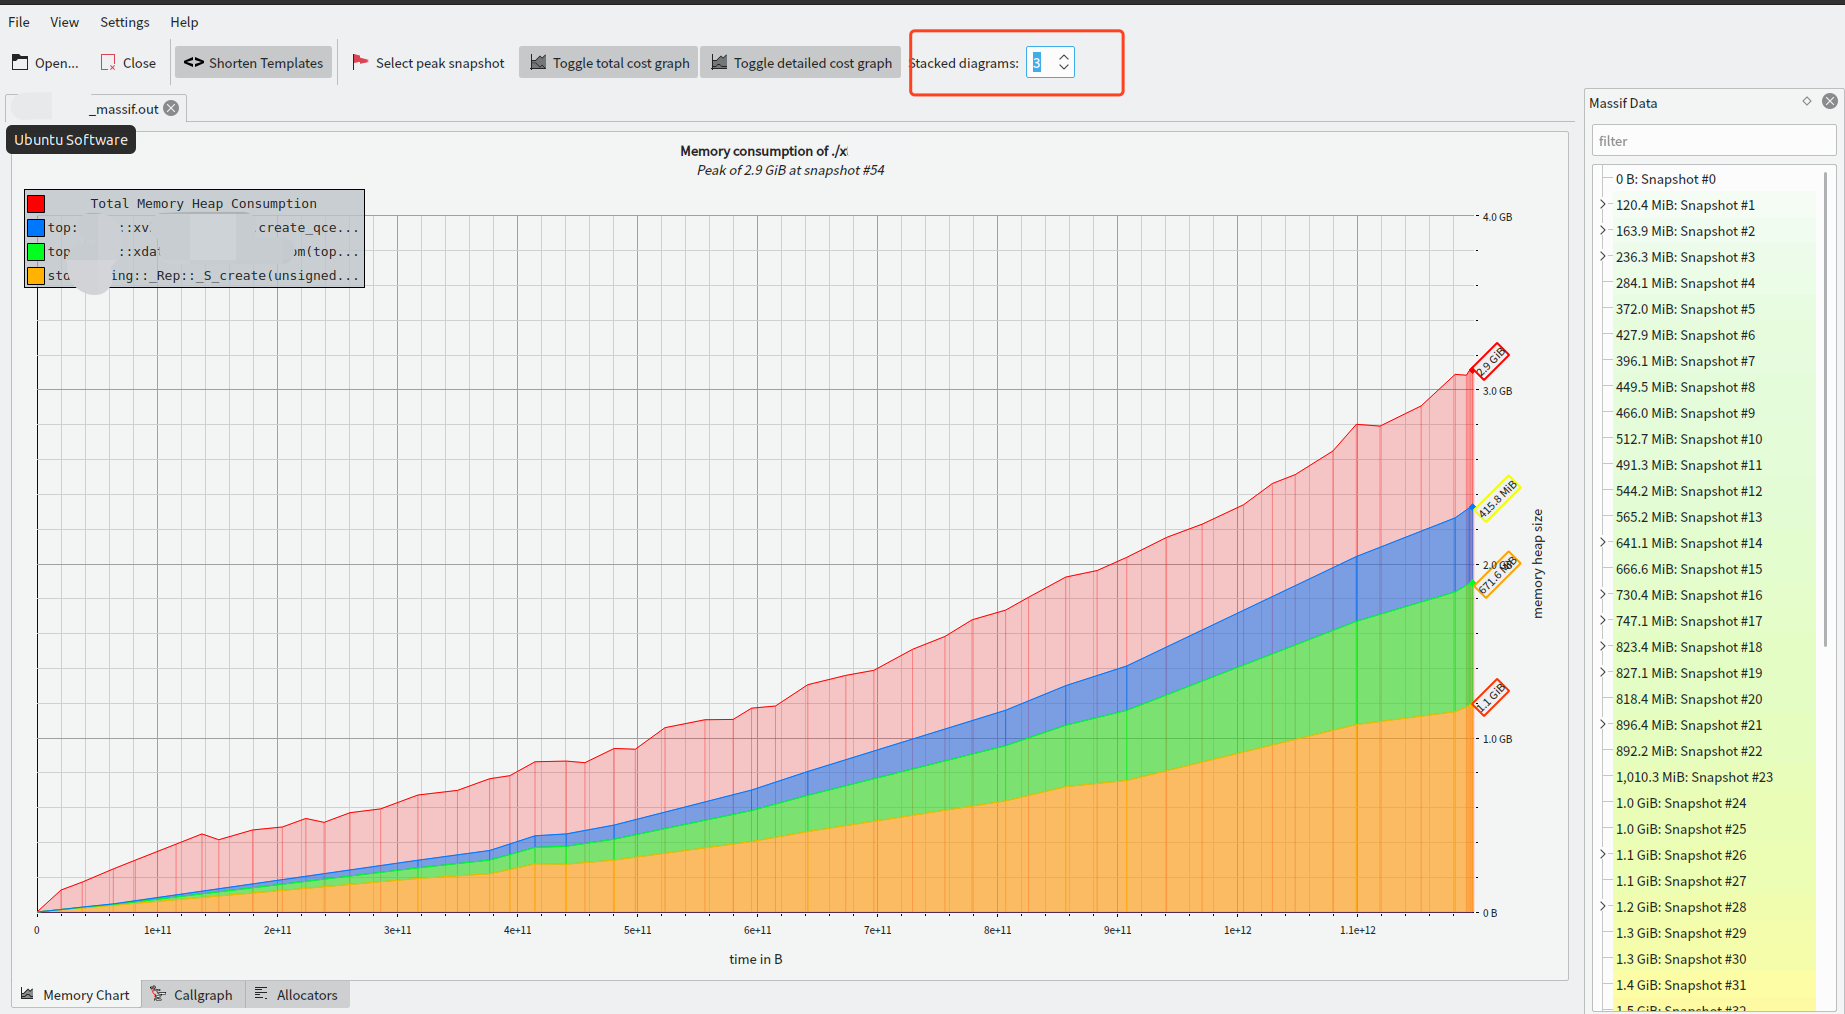
鼠标悬停之后也能看到每条曲线某个 snapshot 对应的内存分配情况。
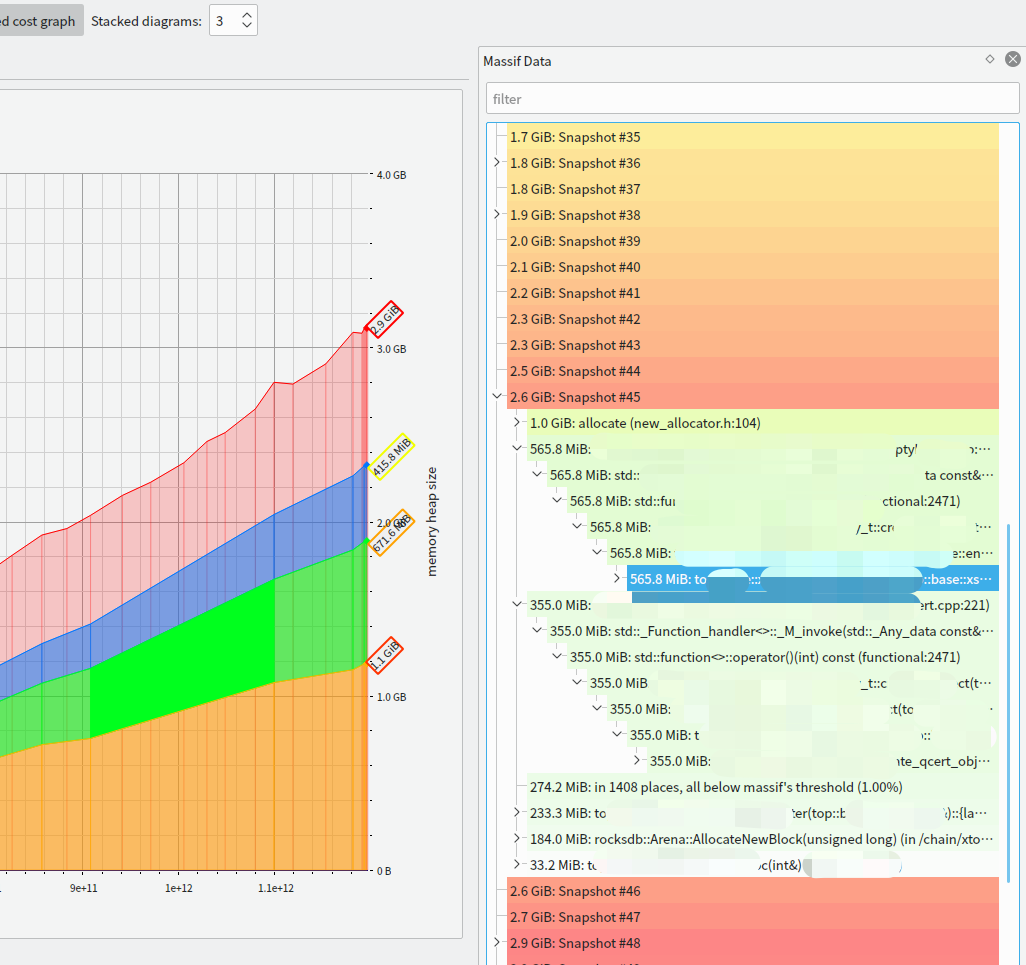
界面右边是内存调用的堆栈:

点击界面下面的 Allocators 按钮之后,可以看到内存分配的排行榜:
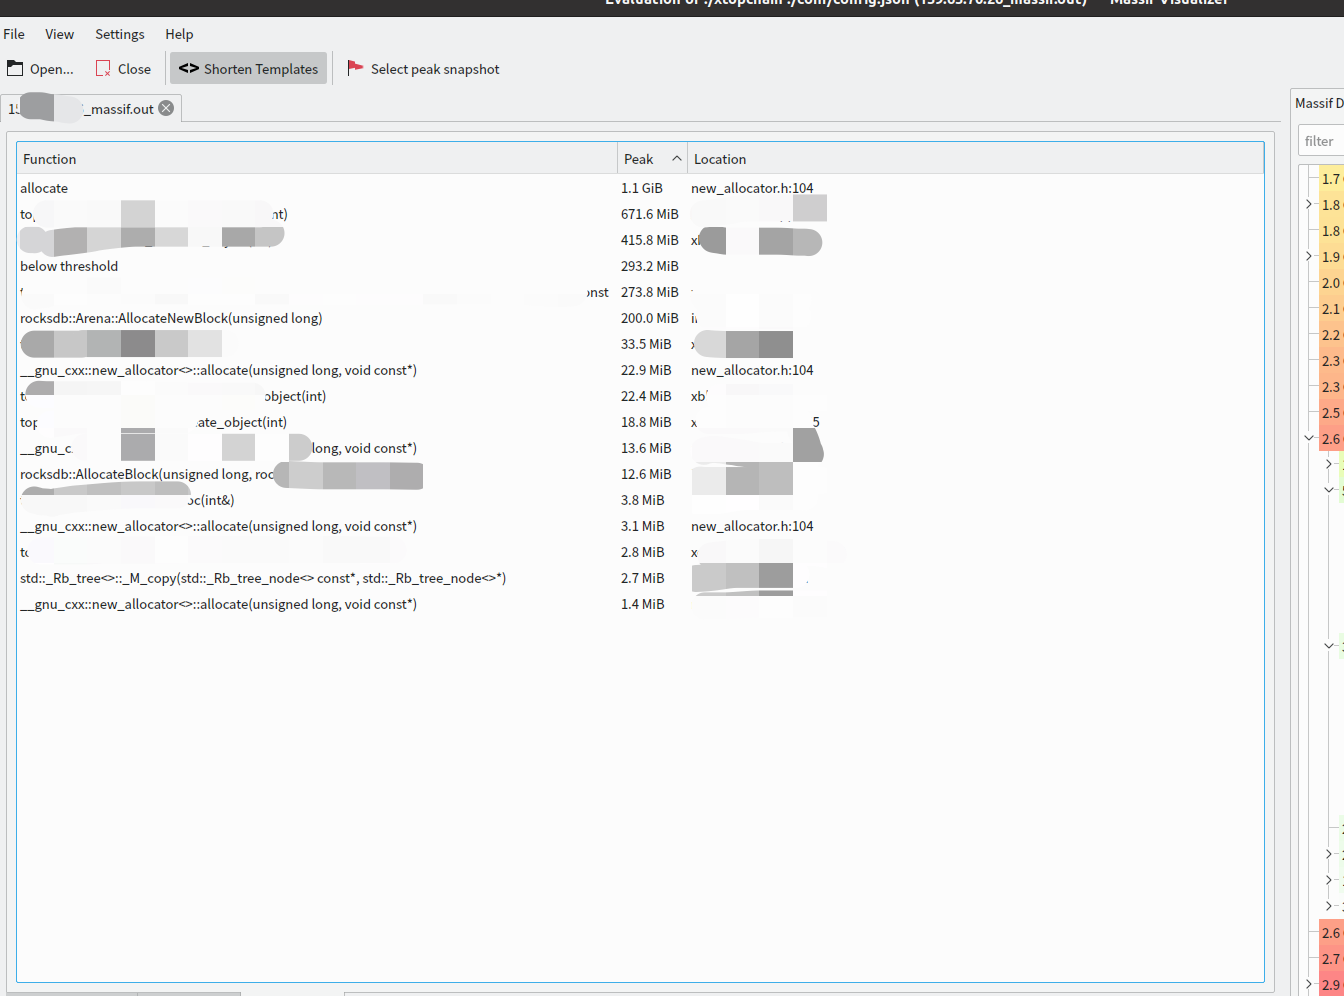
是不是很方便?

写在最后

其实用于分析内存分配情况的利器还可以采用 google-perftools,也是采用对内存采样的方式进行采集,然后生成不同的内存采样文件,结束之后比较两个内存采样文件,就可以分析内存分配情况,同时也能展示初内存分配的函数调用栈。不过相比较于 valgrind 的 massif 插件,google-perftools 是需要代码侵入的,并且不能直观的展示内存随采样时间的变化情况

而 massif 采样的内存数据文件,借助 massif-visualizer 工具就能直观的感受到内存分配随采样时间的变化情况。

Blog:

2020-06-16 于杭州
By 史矛革

buy me a cola!

欢迎关注我的其它发布渠道